USER_GRAPH 2
Data from a USER_GRAPH can be saved and plotted with Matplotlib into a publication-ready figure.
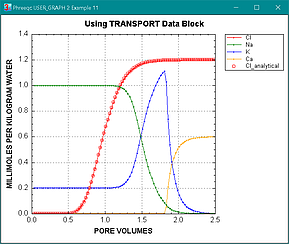
As an example, run ex11.phr from the PHREEQC examples.
|
PHREEQC
USER_GRAPH 2 | |
Right click in USER_GRAPH 2, select 'Save data to file...'.
Save as: \temp\curves.u_g
Copy the python file plot_u_g.py in Notepad++ and save as c:\temp\plot_u_g.py
Open a Command Prompt Window, type Python [Enter], and type
>>> with open('\\temp\\plot_u_g.py') as pug: exec(pug.read()) [Enter]
...[Enter]
>>> Give full path and filename of datafile? \temp\curves.u_g [Enter]
| Matplotlib |  |
If you use Notepad++, it is easy to add a UserDefineCommand in <Command name="Python" Ctrl="yes" Alt="no" Shift="no" Key="119">c:\temp\py.bat "$(CURRENT_DIRECTORY)" "$(FILE_NAME)"</Command>
\Users\..\Appdata\Roaming\Notepad++\shortcuts.xml:
Pressing ctrl+F8 in Notepad++ will call python and run the active file.
The file c:\temp\py.bat should read:
rem changes dir to %1 (where the file is in), run file %2
cd %1
C:\Python310-7\python.exe %2
set /P close="OK to quit python ? "
end