
Let's do a column experiment.
A column is packed with very coarse sand, CEC = 1.1 meq/L. The pore water
contains 1 mM Na, 0.2 mM K and 1.2 mM NO3.
The exchanger then consists of 0.55 mmol Na-X / L and 0.55 mmol K-X / L.
A 0.6 mmol CaCl2 / L solution is injected and the outflow is
sampled and analyzed.
Initially, the (Na,K)NO3 solution leaves the column. After 1
pore volume, NO3
is displaced and Cl arrives at the column outlet. Ca is retarded by exchange with Na and K.
A chromatographic pattern develops because Na is exhausted earlier than K. The development of seperate bands of
(Na,K), K and Ca is illustrated in the figure.
In essence, chromatography is ruled by the ratio of sorbed (q) over solute (c) concentrations.
A larger ratio increases buffering of solute concentrations and retards concentration changes. Actually,
the slope of the q / c isotherm determines the retardation (see Appelo and Postma (2005)
for full explanation).
The retardation of the K / Na front is R = 1 + Δq / Δc = 1 + 0.55 / 1 = 1.55.
The retardation of the Ca / K front is R = 1 + Δq / Δc = 1 + 1.1 / 1.2 = 1.92.
After injection of 1.92 pore volumes, the CaCl2 solution travels unchanged through the column.
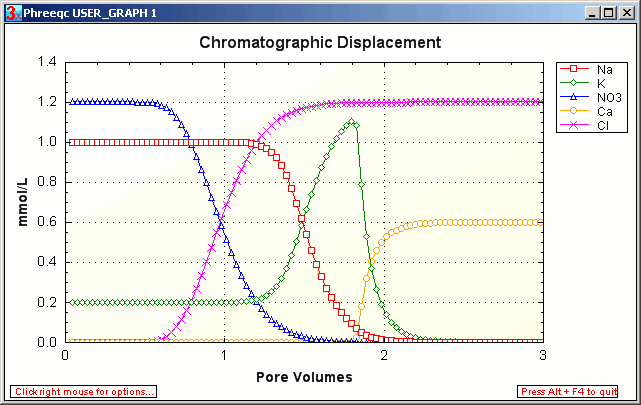
The PHREEQC input file chrom.phr simulates the outflow from the column. An 8 cm column is subdivided in 32 cells, with SOLUTION 1-32 and EXCHANGE 1-32. The injected solution has number 0 (it enters cell 1). The transport properties of the column are defined with keyword TRANSPORT. The dispersivity is 2 mm, which gives a gradual transition of the fronts, but the positions of the midway concentrations do agree well with the retardation calculated before. Note that the steepness of the fronts is also affected by the slope of the exchange isotherm, as explained in Appelo and Postma.