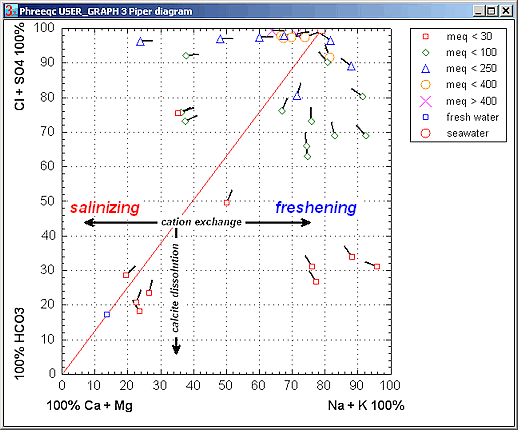
The square form of the Piper diagram below shows groundwater amalyses from Zeeland, an area in The Netherlands where transgressions and regressions of the sea have been numerous.
The red line indicates the composition that mixing of fresh- and sea-water will give without any reactions. The groundwater analyses are not on the line, and the reactions can be traced with the black tail, which, at each sample, points to the position on the mixing line based on the Cl-concentration. Because of cation exchange, the composition changes from NaCl-type to CaCl2-type with seawater intrusion; when fresh water displaces seawater the water turns to a NaHCO3-type. In addition, calcite dissolves in the freshening water (see Appelo and Postma for details and calculations).
The analyses are plotted with the PHREEQC file Piper.phr.
The analyses stem from the Dutch database, available for free at TNO's DINOloket.