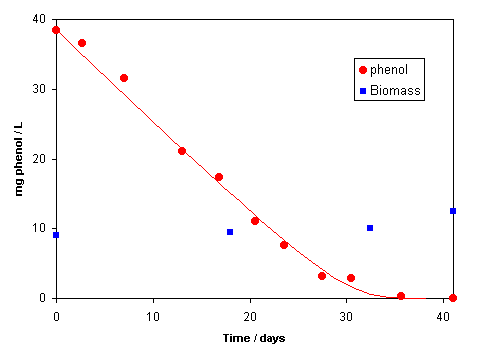
The concentrations of phenol and biomass during methanogenic degradation in a laboratory experiment are shown in the figure (Bekins et al., 1998, GW 36, 261). The phenol concentration decreases linearly with time (characteristic for a zeroth order degradation rate), but the degradation declines at very small concentrations.

The PHREEQC input file given in Example 10.7 calculates the line in the graph. Note that the rate is zero order when the phenol concentration is above 5 mg/L (about 3 times higher than k½, the slope d S / dt is constant), but that it becomes first order with respect to phenol (= S) at lower concentrations.